Most pitch decks fail at explaining how they get customers.
Investors review dozens of pitch decks weekly. The customer acquisition slide determines if they'll take a meeting or pass.
This slide proves you understand your market. It shows you can grow predictably. It validates that customers actually want your product.
Below: how to create customer acquisition slides that get investors interested. Real examples from Ellty templates included.
What is a customer acquisition slide
The customer acquisition slide shows how you attract, convert, and retain customers.
It appears in the middle section of your pitch deck, typically slides 7-10. After you've shown the problem and solution, this slide proves people will pay for it.
Key components:
- Acquisition channels - where customers come from
- Customer acquisition cost - what you pay per customer
- Conversion metrics - your funnel performance
- Growth trajectory - customer growth over time
The slide answers three investor questions: Can you get customers? Can you get them profitably? Can you scale?
Bad slides list marketing tactics. Good ones show data-backed acquisition engines.
Customer acquisition slide examples
Slides from Ellty templates show how different business models present customer acquisition.
Series B pitch deck


This template structures customer acquisition for growth-stage companies:
Customer Acquisition Channels (Q4 2024)
- Paid Search: 35% of customers, $125 CAC
- Organic: 28% of customers, $45 CAC
- Sales Outbound: 22% of customers, $380 CAC
- Referrals: 15% of customers, $65 CAC
Monthly Customer Growth
[Bar chart showing growth from 1,200 to 3,400 customers over 12 months]
Unit Economics
LTV: $1,850
Blended CAC: $147
LTV:CAC Ratio: 12.6x
Payback Period: 4.2 months
The Series B template emphasizes efficiency metrics. Companies at this stage must prove they can scale without burning cash.
Mobile app pitch deck

Mobile apps show different metrics:
User Acquisition Breakdown
- App Store Organic: 42%
- Paid UA Campaigns: 31%
- Social/Influencer: 18%
- Referrals: 9%
Cost Per Install by Channel
Facebook Ads: $2.34
Google UAC: $3.12
TikTok Ads: $1.56
30-Day Retention by Source
Organic: 34%
Paid: 22%
Referral: 48%
Mobile investors focus on organic percentage and retention differences. High CPI with low retention kills unit economics.
Most important metrics get largest space. Supporting data provides context without overwhelming.


What investors look for in customer acquisition slides
Investors scan for specific signals in your customer acquisition data.
Scalable channels
They want channels that grow with investment. Paid ads that maintain ROI at higher spend. Content marketing that compounds. Sales processes that new hires can replicate.
One-off tactics don't interest them. PR hits, Product Hunt launches, founder networks - these don't scale.
Show channels where $10K investment becomes $100K with similar efficiency.
Unit economics that work
CAC must be lower than customer lifetime value (LTV). The ratio matters.
SaaS companies need 3:1 LTV to CAC minimum. E-commerce can work at 2:1. Marketplaces often start at 1.5:1 but improve with scale.
Include payback period. How many months until you recoup acquisition costs. Enterprise SaaS accepts 12-18 months. Consumer apps need 3-6 months.
Proof of demand
Growing customer numbers prove market demand. But context matters more than absolute numbers.
B2B SaaS with 50 enterprise customers beats B2C app with 10,000 free users.
Show month-over-month growth rates. Accelerating growth beats linear growth. Include cohort retention to prove customers stay.
Channel diversity
Single channel dependency scares investors. Facebook changes algorithm. Google updates hurt SEO. Sales team quits.
Show 2-3 working channels. One primary driver plus emerging channels. This proves you're not vulnerable to platform changes.
Investors pattern match. They've seen what works in similar companies. Your metrics should align with successful companies in your category.
Must-have components
Every customer acquisition slide needs specific data points. Missing any weakens your story.


Customer acquisition cost (CAC)
Show your fully-loaded CAC including all costs: marketing spend, sales salaries, tools, overhead allocation.
Break it down by channel. Paid ads include ad spend plus management time. Sales includes salary, commission, and tools.
Investors spot incomplete CAC calculations immediately.
Acquisition channels
List your top 3-5 channels with percentage breakdown. Show which drive growth today and which you're testing.
Include channel name, percentage of customers, CAC, and growth rate for each.
Even small emerging channels matter. Shows you're experimenting beyond current winners.
Conversion funnel
Map your customer journey with specific conversion rates. Website visitors to signups. Signups to trials. Trials to paid customers.
Use your actual numbers. Generic benchmarks signal lack of tracking.
Growth trajectory
Show customer count over last 6-12 months. Monthly for early stage, quarterly for later stage.
Growth rate matters more than absolute numbers. Accelerating growth beats large numbers with flat trajectory.
Include cohort retention if strong. New customers mean nothing if old ones churn.
Key questions your slide must answer
Your customer acquisition slide faces four critical investor questions. Answer all or expect rejection.
How do you acquire customers?
Name specific channels and tactics. "Digital marketing" says nothing. "Google Ads targeting 'project management software' keywords" shows you know your market.
Include your unique acquisition angle. Maybe you partner with consultants. Maybe you rank #1 for key terms. Maybe your product has built-in virality.
Generic acquisition strategies signal no competitive advantage.
What does it cost?
State your blended CAC and CAC by channel. Investors calculate LTV:CAC ratios instantly.
Compare your CAC to competitors if favorable. "$125 CAC vs industry average $200" proves efficiency.
High CAC needs justification through high LTV or improving unit economics.
How fast are you growing?
Show customer growth rate, not revenue. Revenue can grow through price increases. Customer growth proves market demand.
Include both absolute numbers and percentage growth. "From 100 to 200 customers" means different things for B2B enterprise vs consumer apps.
Highlight acceleration if present. Flat or declining growth rates kill investor interest.
Is it scalable?
Prove channels work at higher spend levels. Show that doubling budget won't double CAC.
Include plans for new channels. Current channels always saturate.
Address obvious scale concerns. Sales-heavy models need proof you can hire and train. Paid acquisition needs proof of sustainable unit economics.
Investors funded similar companies. They know what scales and what doesn't. Address their pattern matching directly.
Design tips
Customer acquisition slides fail when data becomes unreadable.
Visual hierarchy
Lead with your best metric. Make it huge.
If CAC payback is 3 months, that's your headline. Growing 40% monthly? Feature it prominently. Secondary metrics get medium size. Supporting details stay small.
Use color strategically:
- Green for positive metrics
- Gray for context
- Red only for critical issues
Choose the right charts
Different data needs different visualization.
Channel mix works best as pie or donut charts. Growth over time needs line graphs for smooth trends, bar charts for discrete periods. Funnel metrics require actual funnel visualization - width shows volume at each stage.
Skip 3D effects. Skip gradients. Skip decoration.
Clean data wins.
Balance data and whitespace
Cramming every metric makes slides unreadable.
Include 3-5 key data points maximum. Group related metrics. Channel performance here, growth trajectory there, funnel metrics in another section.
One insight per chart.
Make numbers scannable
Round aggressively. Nobody cares about $127.43 CAC. Make it $127.
Add context inline. Don't just show "$125 CAC" - show "$125 CAC (60% below industry)".
Keep formatting consistent throughout. Currency for money metrics. Percentages for rates. Multiples for ratios. Don't mix formats for similar metrics.
Icons help recognition but don't overdo it. A simple phone for sales calls, shopping cart for e-commerce. Skip if they add clutter.

How to create your customer acquisition slide
Building an effective customer acquisition slide starts with real data.
Step 1: Gather metrics
Pull 6 months of data:
- Customer counts by month
- Marketing spend by channel
- Conversion rates per funnel stage
Use actual numbers from analytics and CRM. Estimates are obvious.
Step 2: Calculate true CAC
Include all costs: ads, salaries, tools, contractors. Most founders undercount.
Calculate by channel. Your blended CAC might hide unprofitable channels.
Step 3: Choose your story
What's your competitive advantage?
Low CAC? Fast growth? New channel? Pick one narrative. Support with 3-4 key metrics.
Step 4: Design with templates
Start with Ellty's pitch deck templates. Replace sample data with yours.
Test the 10-second rule. Can someone grasp your main point that fast?
Avoid these mistakes
Hiding bad metrics backfires. Address weak channels directly.
Using old data (3+ months) signals poor tracking.
Promising unrealistic growth destroys credibility.
Other pitch deck slides explained
From title slides to financial projections - we cover every slide that matters.
Go-to-market slide →
Problem slide →
Competition slide →
Why now →
Get started with proven templates
Customer acquisition slides make or break investor meetings.
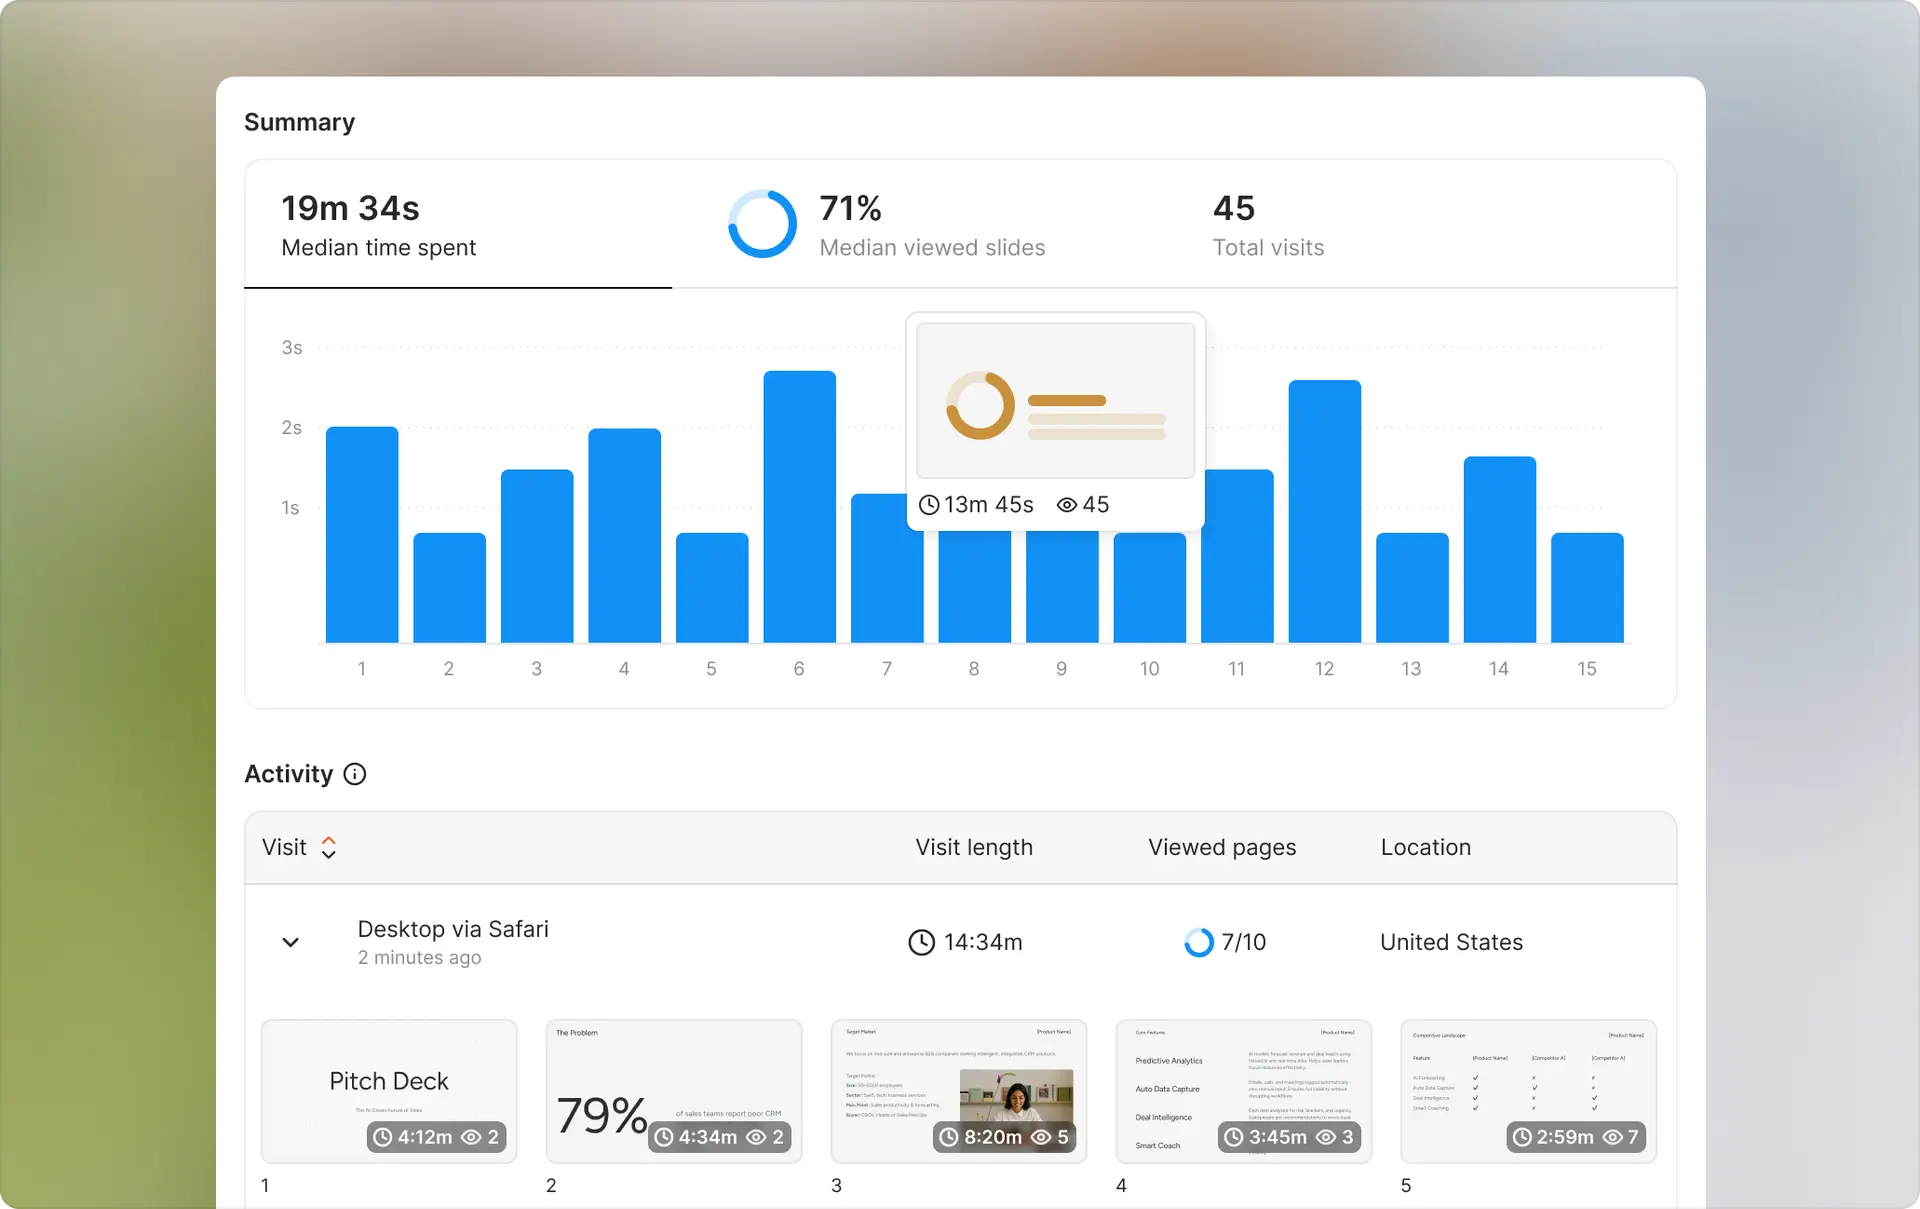
Track how investors interact with your deck. See which metrics they study. Know when they share internally.
Most founders send PDFs blind. You'll see exactly what resonates.
Investors pattern match. Show them acquisition metrics they recognize as fundable.